I have received requests around how to change the colour gradient for the Geographic Heat Map (India) Excel template. In this quick tutorial, I will explain how to do it.
Step 1: Download and open the Geographic Heat Map (India) Excel Template. The map looks like the image below.
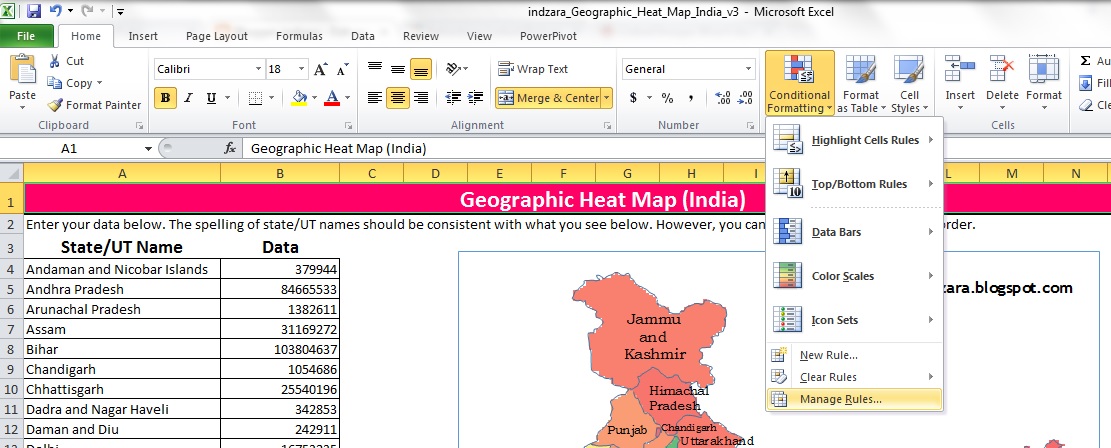
Step 2: Open Conditional Formatting menu and choose Manage Rules
Step 3: Choose Sheet: Data
Step 4: Click Edit Rule
Step 5: You should see the existing conditional formatting rule as shown below
Step 6: Change the colour for the minimum to your choice. This is the colour that will be applied to the states with the lowest numbers in your data.
Step 7: Change the colour for the maximum to your choice. This is the colour that will be applied to the states with the highest numbers in your data.
Step 8: Click OK
Step 9: Click OK in the next dialog box.
Step 10: Back in the Geographic_Heat_Map worksheet, scroll down to row 40. Edit the text to reflect the colours you changed now. (You can enter any text here as you prefer.) This will be displayed on the map image so that those who read the map understand the colour gradient used.
Your map image will update automatically.
Step 1: Download and open the Geographic Heat Map (India) Excel Template. The map looks like the image below.
 |
| Geographic Heat Map (India) Excel Template |
 |
| Geographic Heat Map (India) Excel Template - Step 2 - Conditional Formatting |
 |
| Geographic Heat Map (India) Excel Template - Step 3 - Choose Sheet: Data |
 |
| Geographic Heat Map (India) Excel Template - Step 4 - Click Edit Rule |
 |
| Geographic Heat Map (India) Excel Template - This is the existing rule |
 |
| Geographic Heat Map (India) Excel Template - Step 6 - Choose a different color for Minimum |
 |
| Geographic Heat Map (India) Excel Template - Step 7 - Choose a different color for Maximum |
 |
| Geographic Heat Map (India) Excel Template - Step 8 - Click OK |
 |
| Geographic Heat Map (India) Excel Template - Step 9 - Click OK |
 |
| Geographic Heat Map (India) Excel Template - Step 10: Type the new Colour Gradient |
Your map image will update automatically.
 |
| Geographic Heat Map (India) Excel Template - After changing Colours |
Heatmap is a great tool to design a webpage more interactive and creative to capture visitors attention. It do tells the problem area of the webpage which needs to be improved and redesigned. Thanks for sharing with us such a wonderful post.
ReplyDeleteIts a great tool. Do you plan to go district level as your next project.
ReplyDeleteCan we have a 4 color scheme in this as well?
Thank you. The current gradient scheme is more flexible. 4 Color Scheme can be set up if needed. Are you familiar with conditional formatting?
DeleteIf you may please look into my requests for district level map and also if we may get multiple colour schemeing not only 3 colour shades, it will be great service to Non profit research organization like us.
ReplyDeleteYes, I do plan to publish district level maps in the future. However, it will take some time. Please e-mail me at indzara at gmail so that I can inform you when I have the district level maps. Which state(s) are you interested in?
DeleteIts a good source in deed.
ReplyDeleteI wanna add values on each state?
How to do that ?
Thank you.
DeleteYou can add text boxes and point them (type = and select the cell where the data is) to each state's data. I think it has to be manually done for each state.
Hi..
ReplyDeleteI also wish to know is there a heat map for Regionwise for India ?
Thanks in advance
I am sorry. I have only this map for now.
Delete